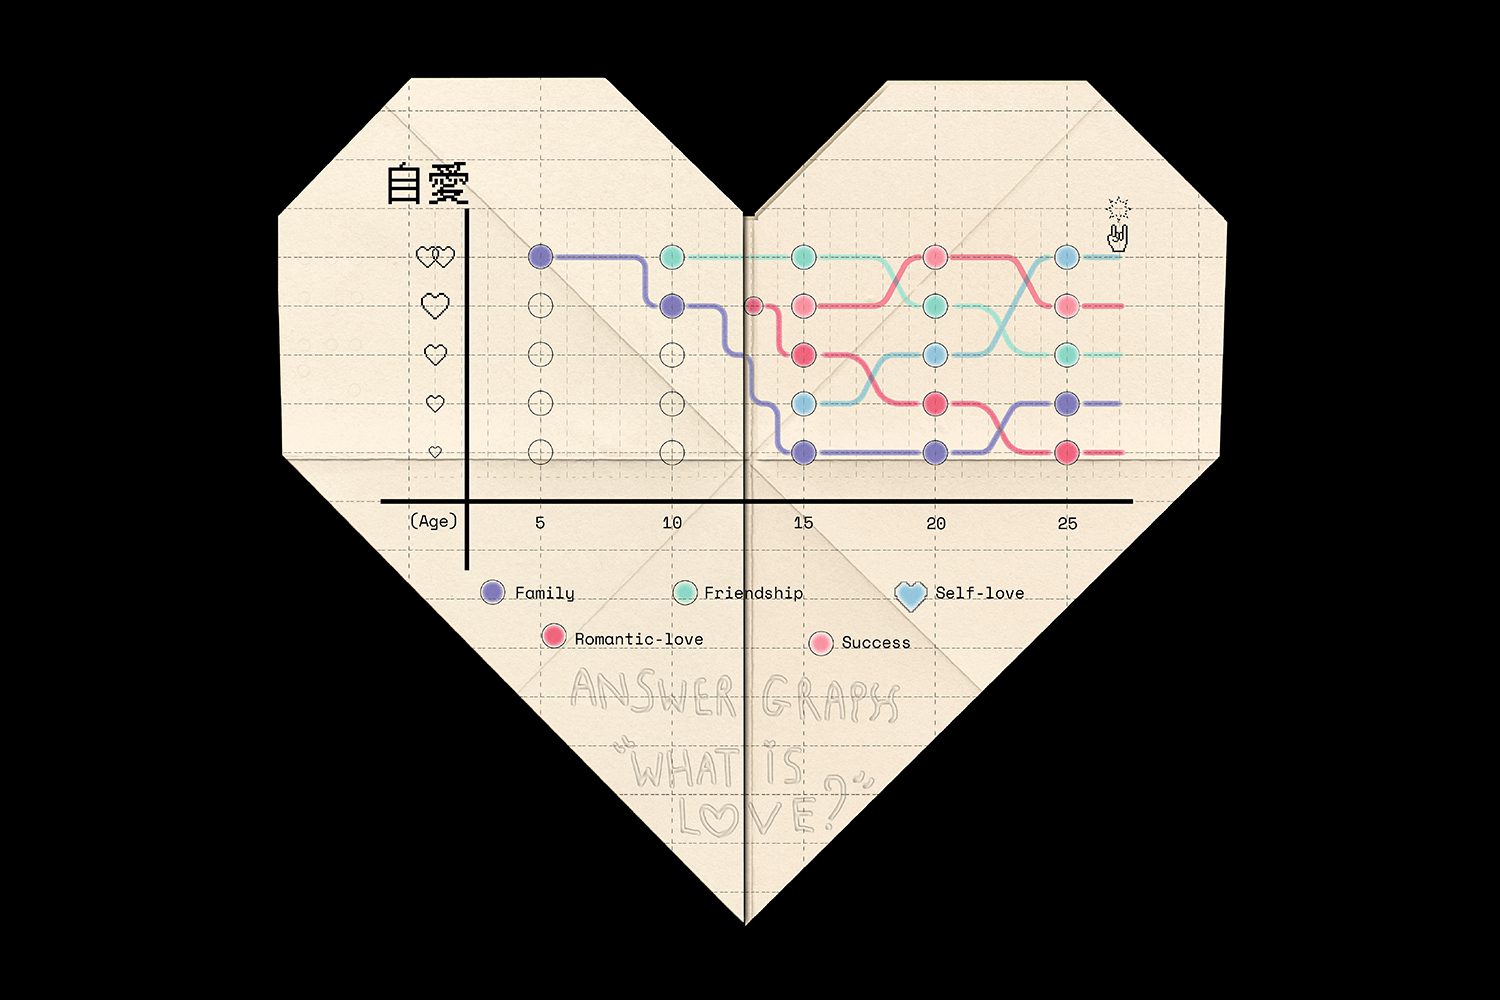
 Answer graph "What is love ?"
 GET TO KNOW POONTANY, AN INFORMATION DESIGNER WHO BLENDS TECHNOLOGY WITH CLASSICS AND TELLS STORIES THROUGH EASY-TO-UNDERSTAND AND ENGAGING GRAPHICS
TEXT: POONTANY
IMAGE COURTESY OF POONTANY
(For Thai, press here)
WHO
I describe myself as an ‘Information Designer’ based in Bangkok. Hi ! I’m Poon Lee Potchanakasem (most people know me as Poontany on social media)
WHAT
‘Information Designer’ is an occupation that focuses on information and data. We explain complex information, either through numbers or text by using ‘data visualization,’ which is explained using graphs, charts, diagrams, and maps. Depending on the project, sometimes it could be an information graphic or illustration.
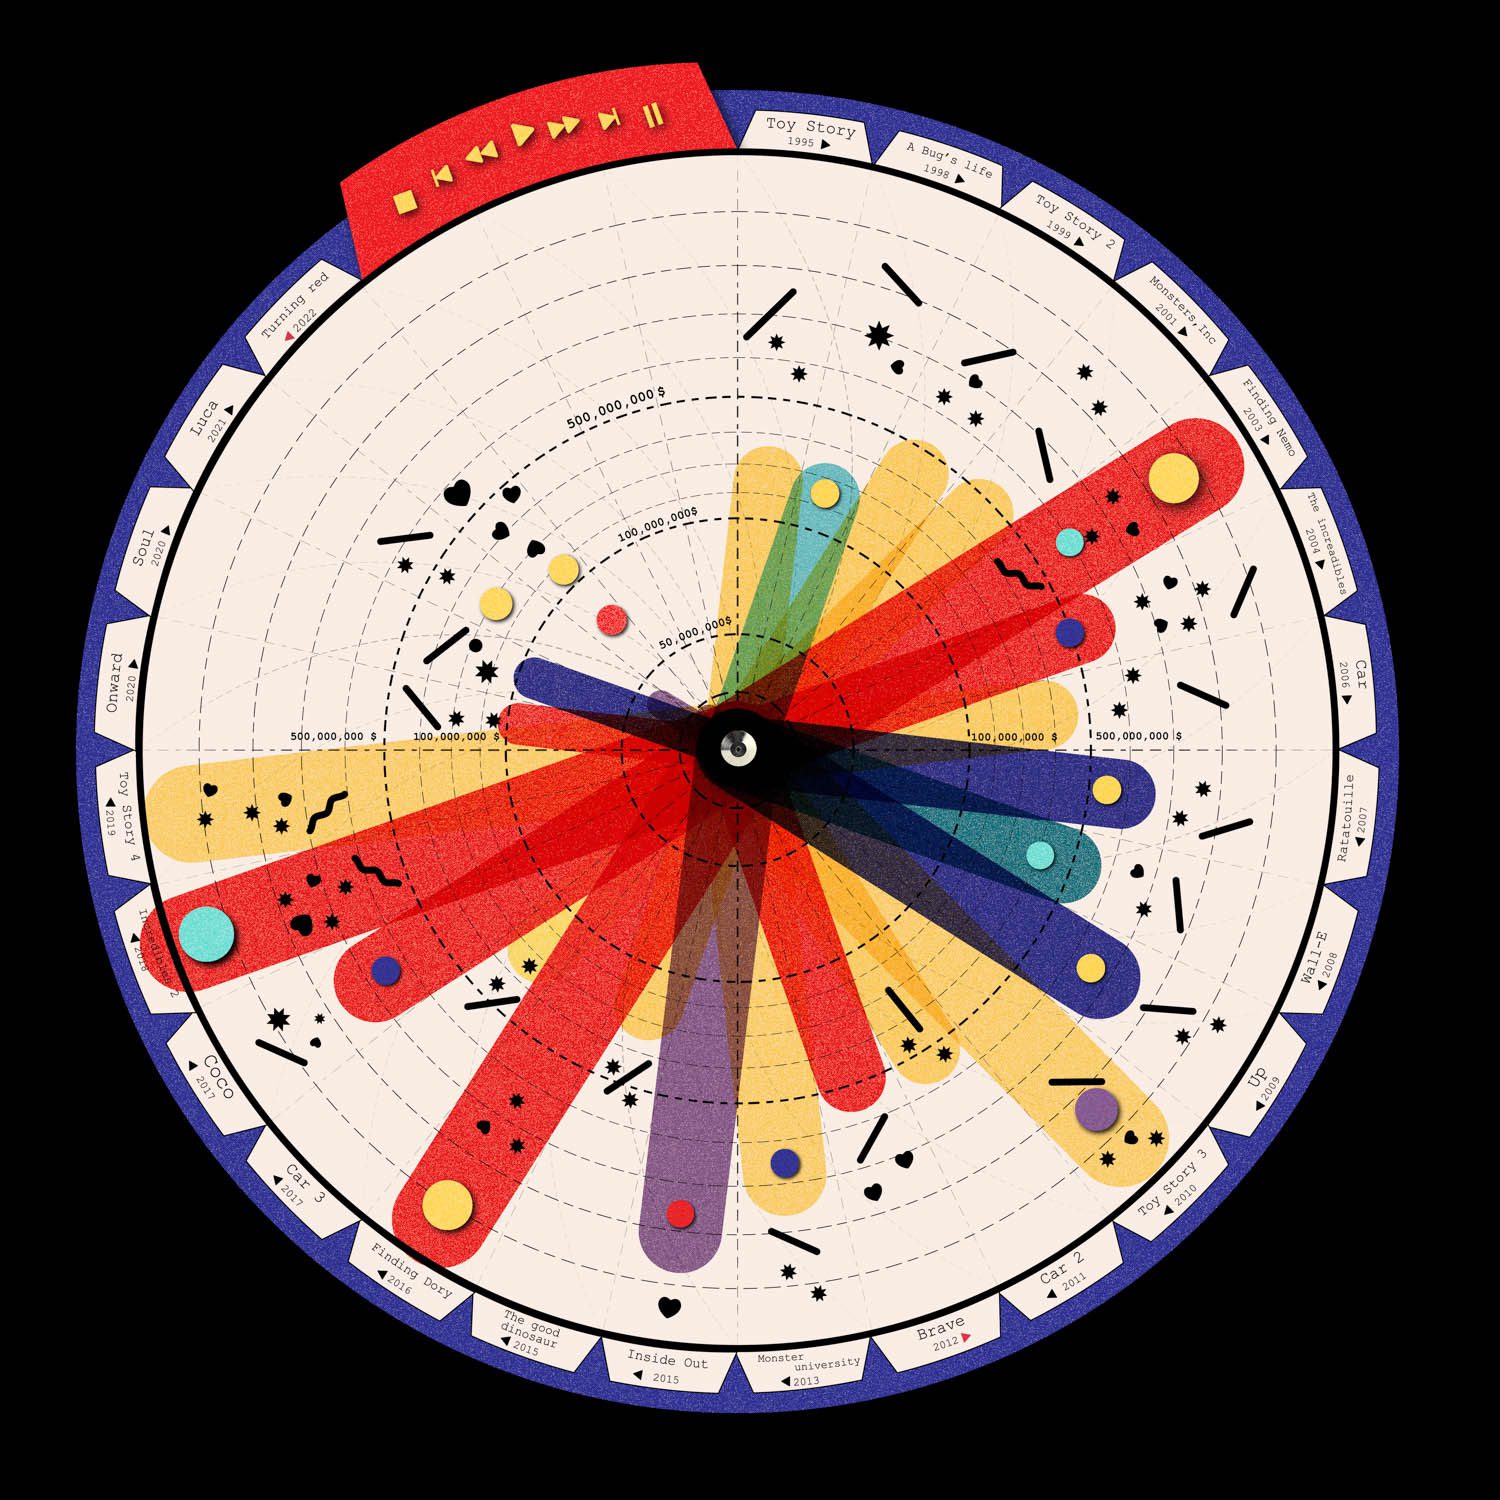
Pixar Encyclopedia
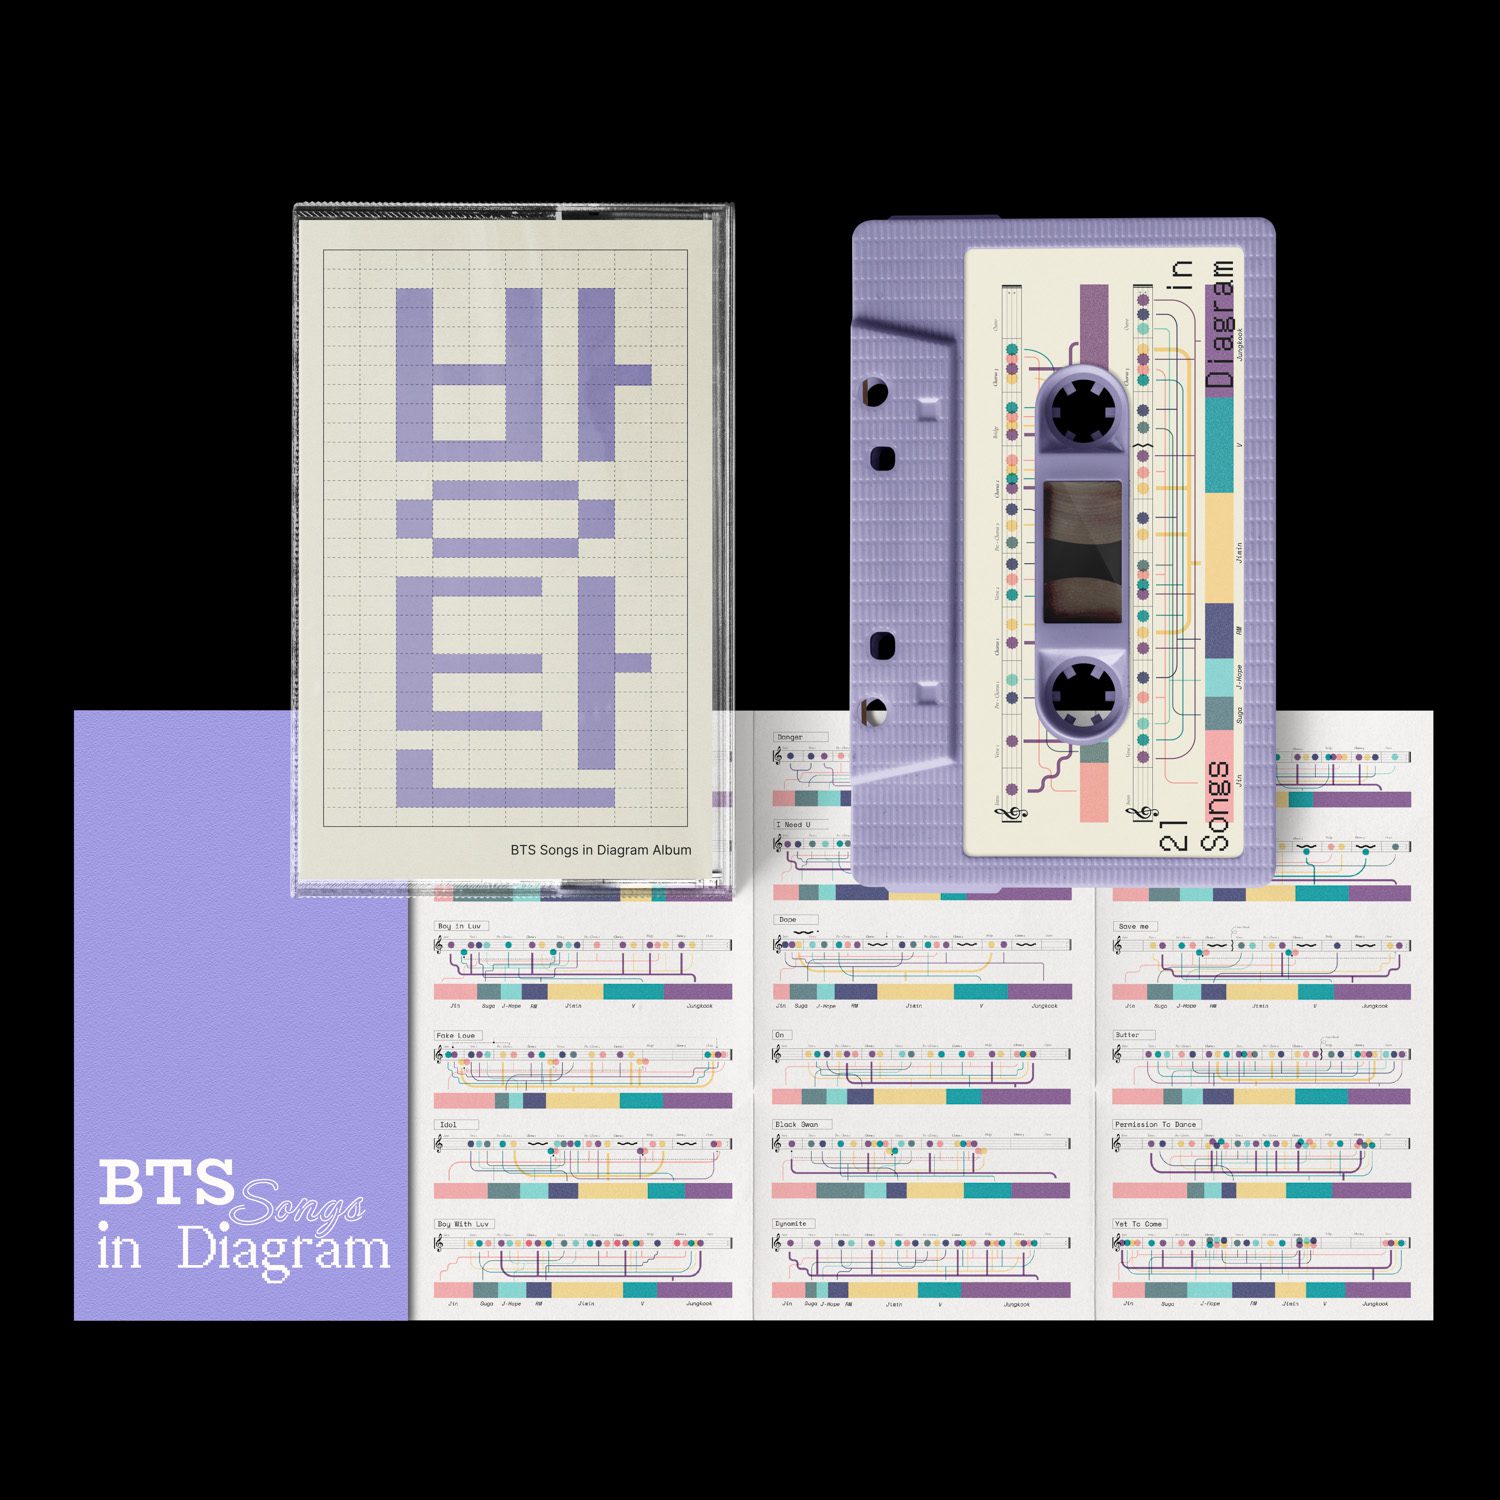
BTS Songs in Diagram
Besides that, I was an author of online web content CONT. the article titled ‘Data Journalread’ – an easy reading data journalism. Every month data with interesting topic will be selected and then explained visually with data visualization. An example of this is: Pixar Encyclopedia in Data, BTS songs in Diagram
WHEN
On 31st August 2021. Which is the 4th year of my professional career now.
WHERE
The designer is always based on Bangkok although sometimes the works have been featured internationally in the US or UK.
WHY
I like to question about the new possibilities. Normally we see design + data + technology which has become normal. But I desire to do something new, so I combined design + data + printing to shift the output of data visualization from the internet to printing work.
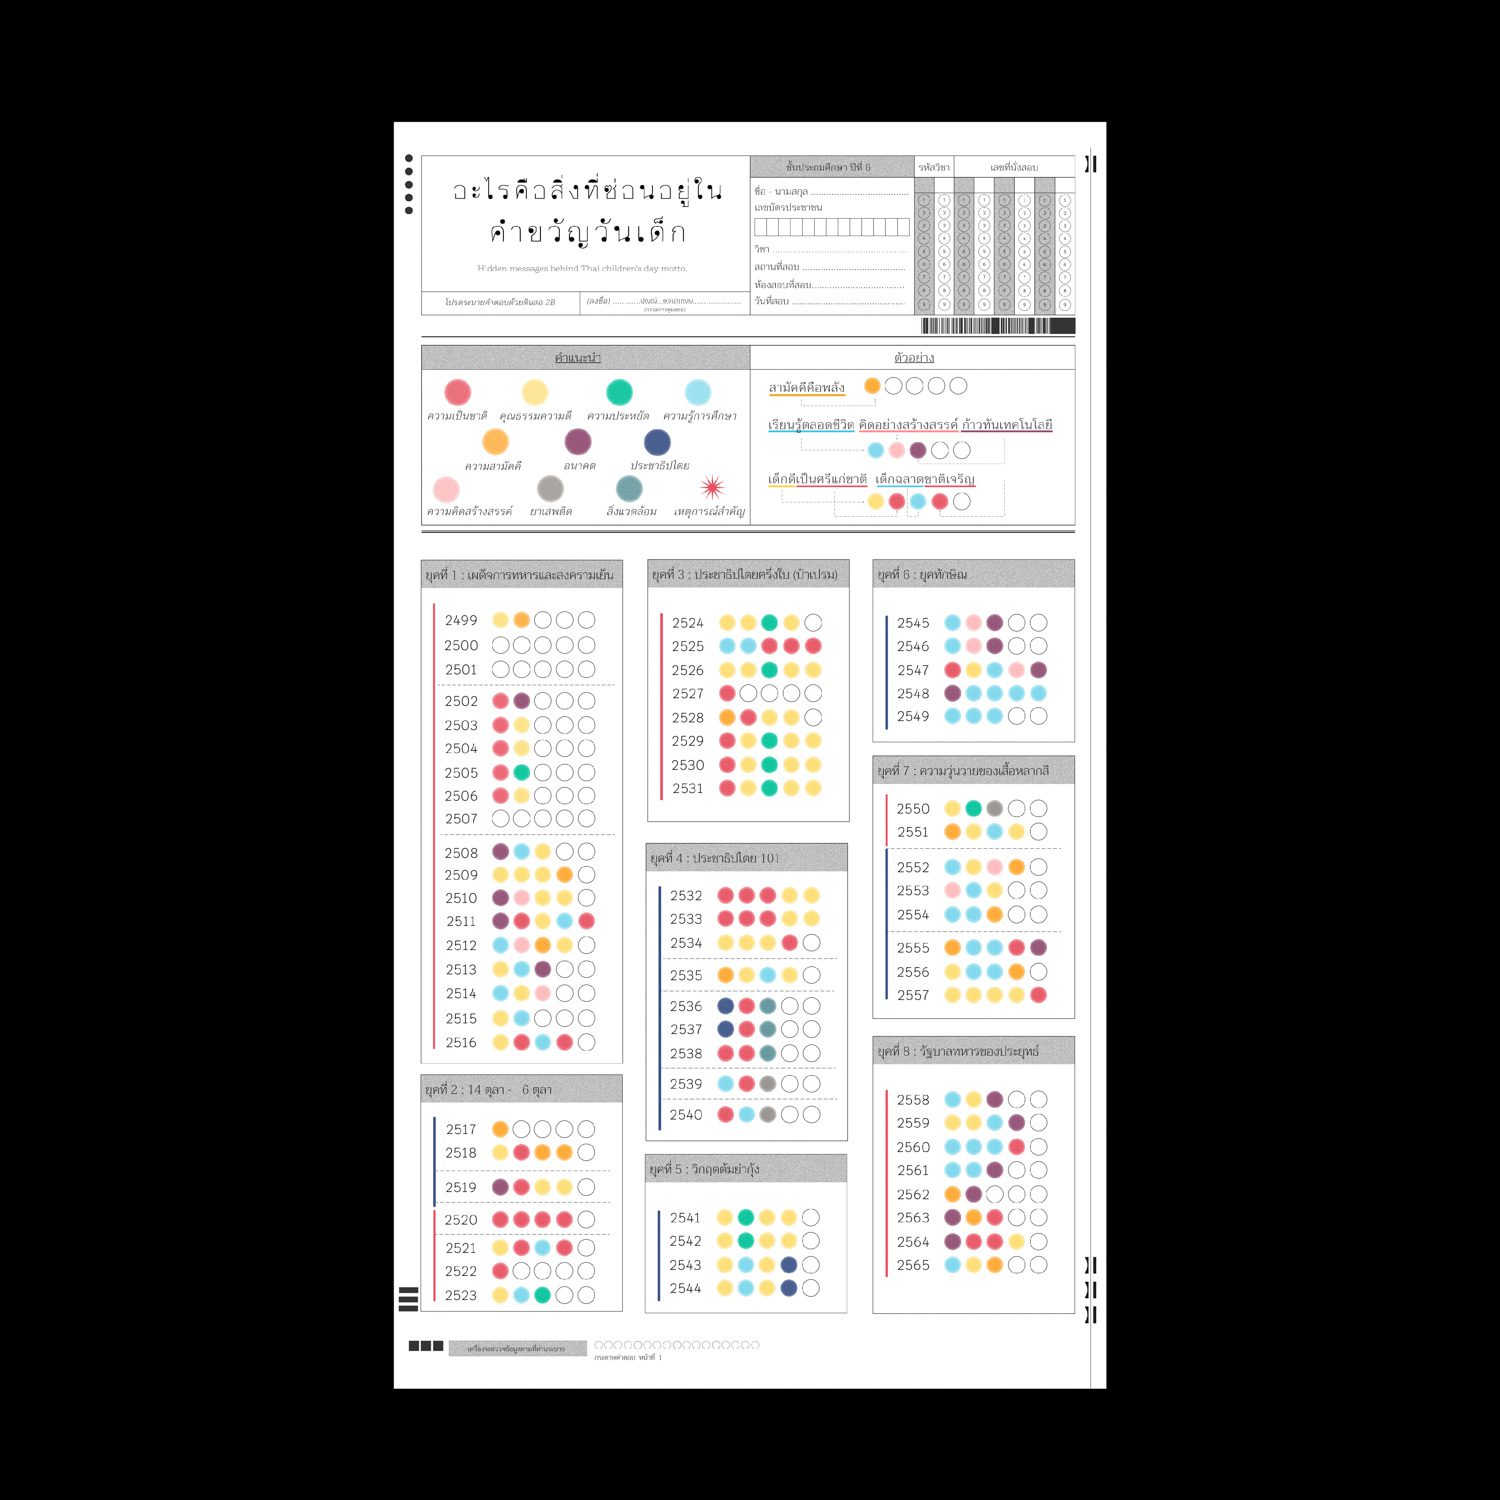
Children’s day motto data visualization
How do you define your own style of work?
Retro-futurism and nostalgic reminiscences. Data visualization symbolizes something from the future but I love storytelling through vintage items which symbolizes the retro.
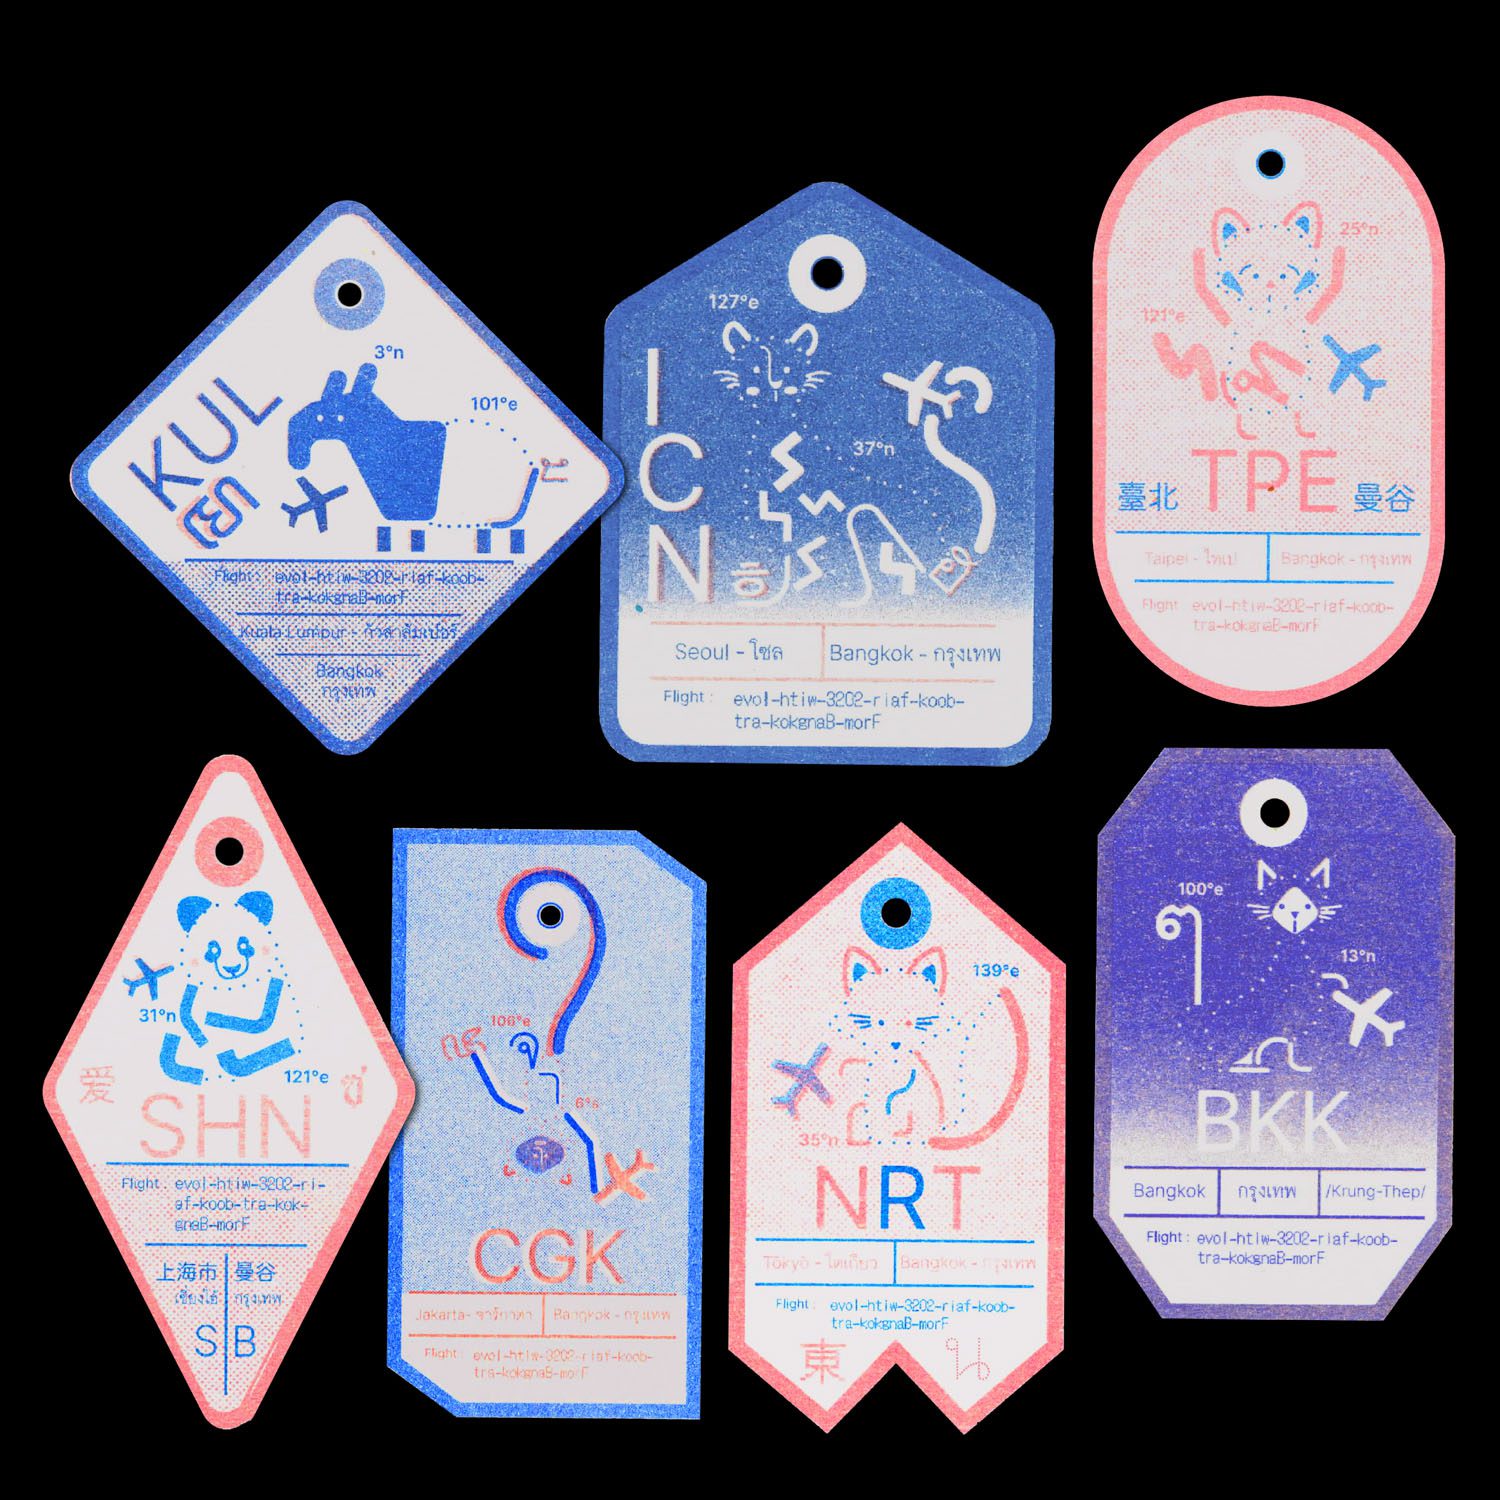
Riso Luggage tag
What inspires you and what principles do you apply to each project?
I love to walk in the old town of Bangkok. Observing the typography on the shophouses, reading the vintage book in the national library, reading the old documents in the national archive, visiting the vintage vinyl shop. You are able to see the design of vintage records, data and how to use the graph, chart, diagrams on the internet but the old pieces are usually very difficult to find. That is why sometimes on Saturday I love to roam around in the old town to see the real thing.
There were 3 principles before the project started:
1. What project you are currently working on.
2. What the readers of this project will receive.
3. Which information is needed to complete the project.
 Guang Hua
- Guang Hua


Which project are you most proud of and why?
There are various projects that I’m proud of, but this year I will choose ‘Guanghua & Dawn Newspaper.’ I’m not only an Information Designer but also the 3rd Generation heir of the Chinese newspaper ‘Guanghua Bao.’ It is a Chinese newspaper that was ordered the close down the business in 1958 during Sarit Thanarat’s military rule era because it was misunderstood as media that spread communism in Thailand.
This year, I decided to bring it back, after 66 years. It is the same newspaper but the storytelling method is changed from a Chinese Newspaper to data visualization Newspaper that explores stories around the world.
I’m proud to work on this project since it brings back the newspaper from the era of my grandfather. The Chinese newspaper was founded in 1947 in Bangkok but closed down for 66 years. This time the newspaper tells more contemporary stories, In addition to this, I have also published the old graphic elements from the newspaper like an online archive for everyone to see the design works from the past.
For more information visit Guanghua & Dawn
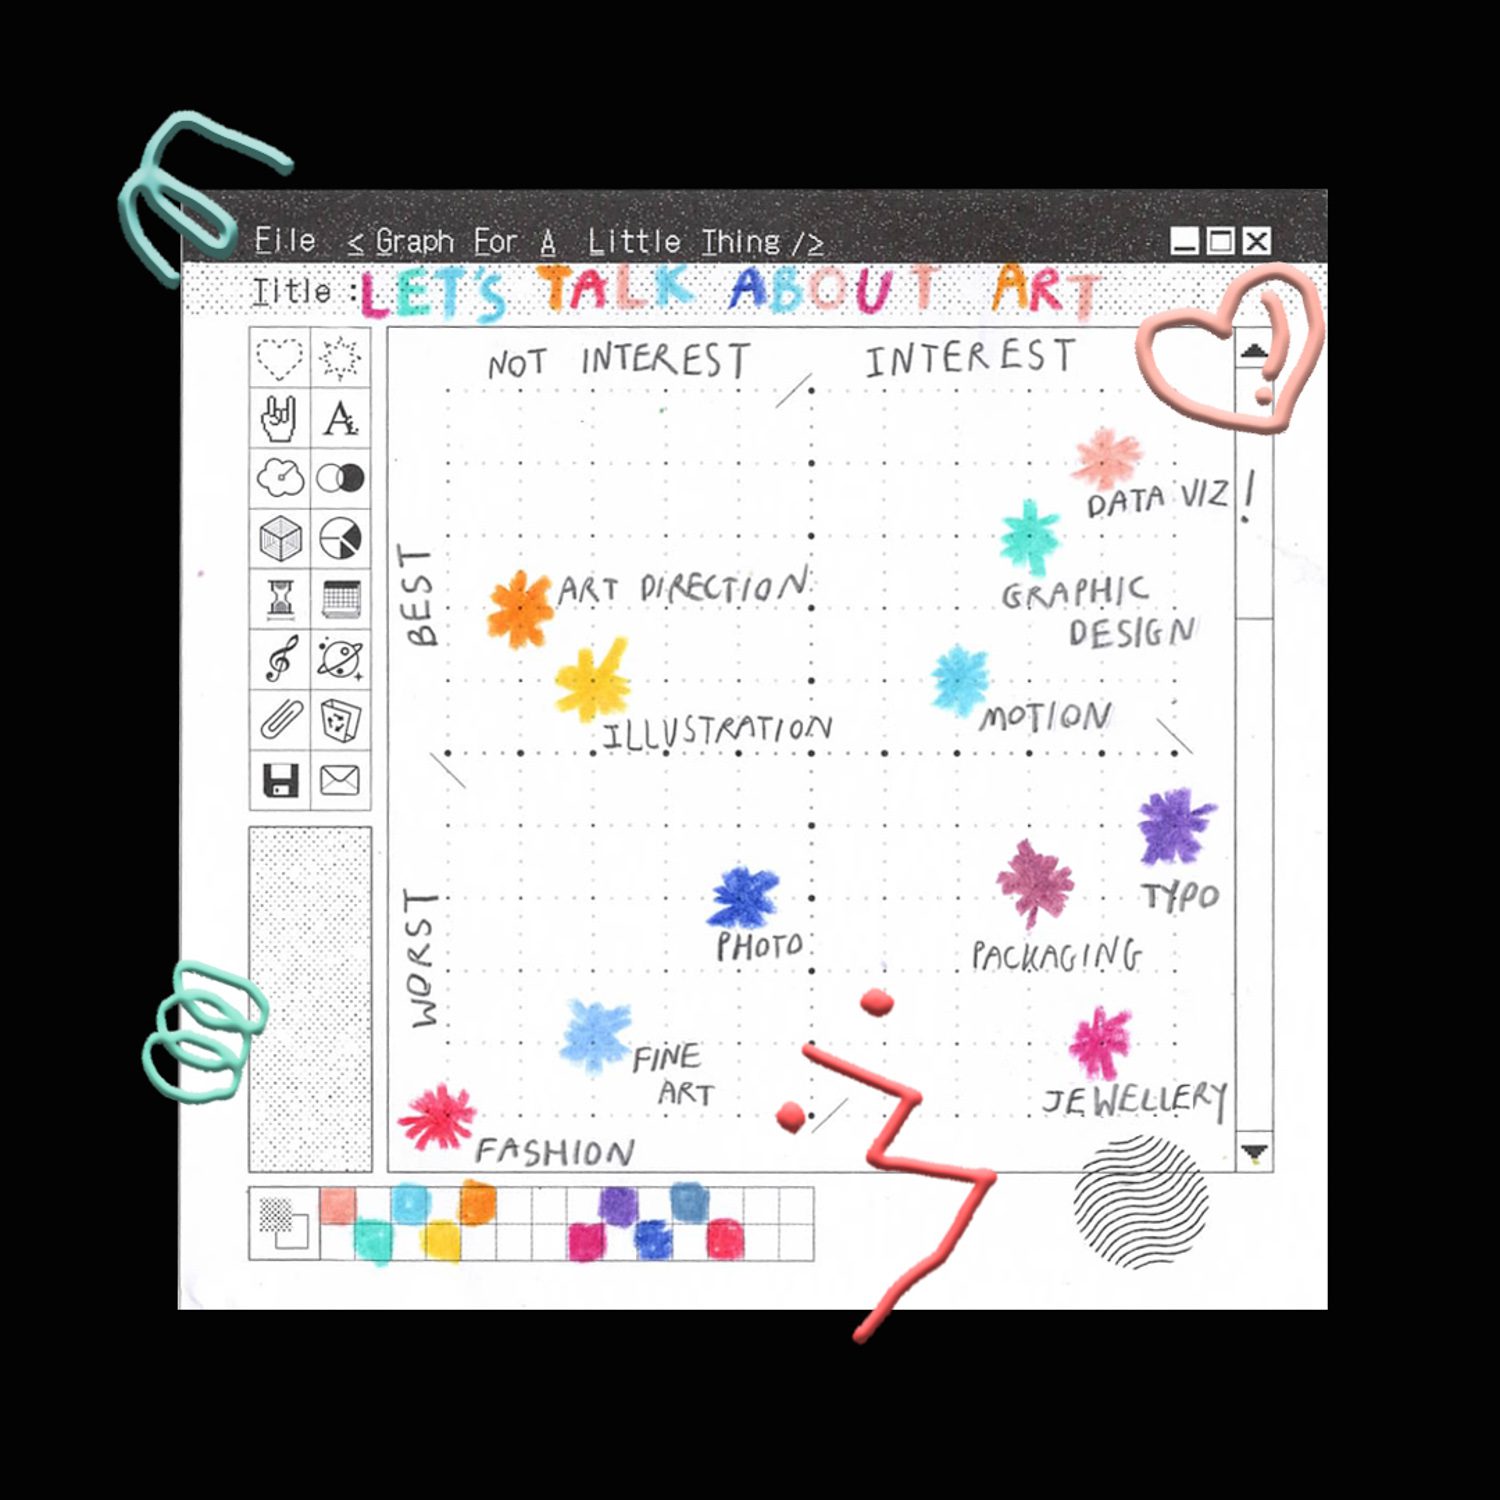
Graph for a little thing
 Bangkok Print Society Survey

Which part of the process do you enjoy the most during work?
My favourite part is definitely ‘research.’ As an Information Designer when a new project starts, you have to do research. I love reading, observing, and questioning. The more you research, the more you will come up with new ideas to develop your work.
If you could invite any ‘creative’ for a coffee, who would it be and why?
I would choose Giorgia Lupi, she is an Information Designer based in the US. She simplifies the complexity of data storytelling pleasantly. I got a lot of inspiration from her during my early stages of my career. I would like to ask her if she got a chance to do some data visualization about Bangkok, what would she do?
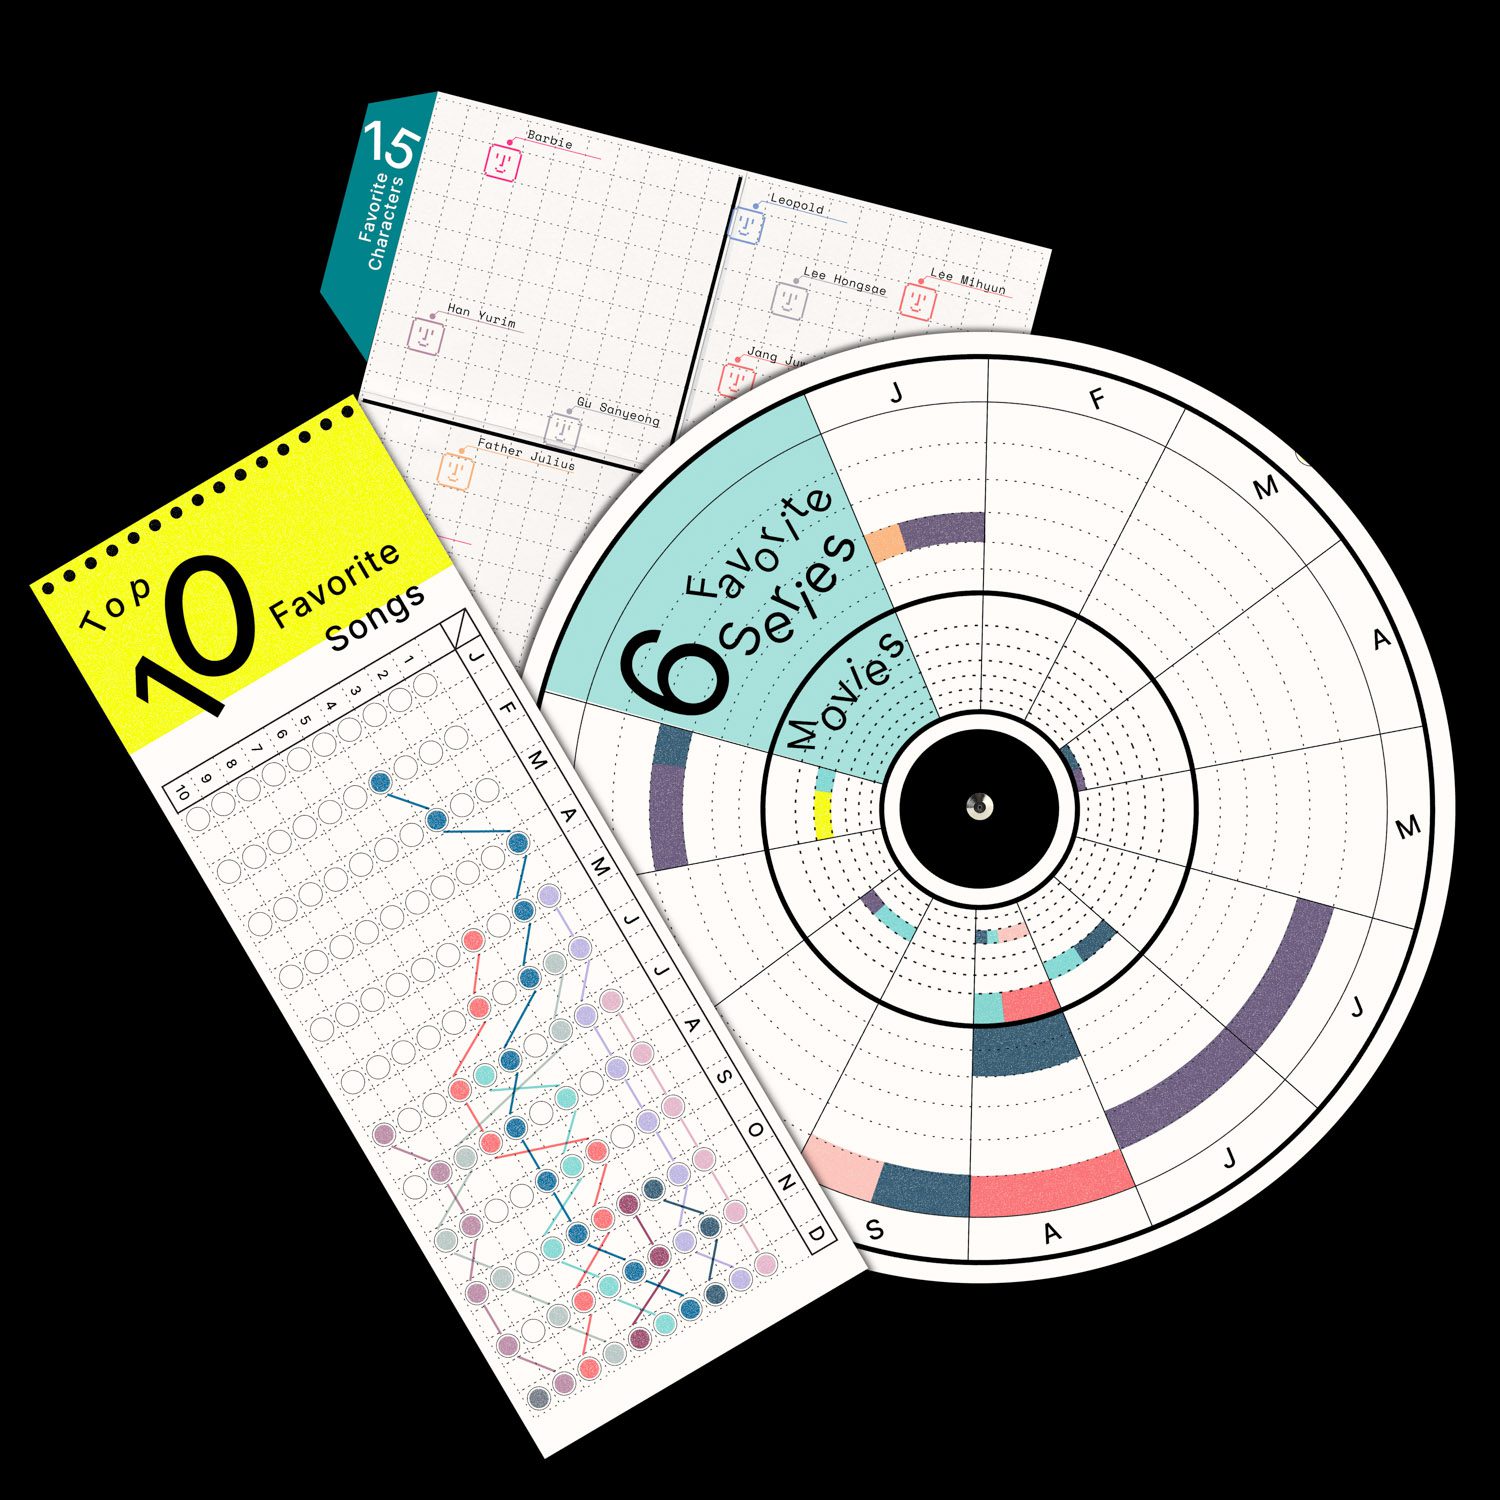
Entertainment Report 2023